
The Hew interface
Find your way around the window, from tool rail to status bar, including the tools that don't have a button on screen.
Hew’s window has the same layout on the web, macOS, Windows, and Linux. The only difference is the chrome around it: macOS uses the system menu bar, Windows and Linux draw their own title bar, and the web app shows an in-app menu bar.
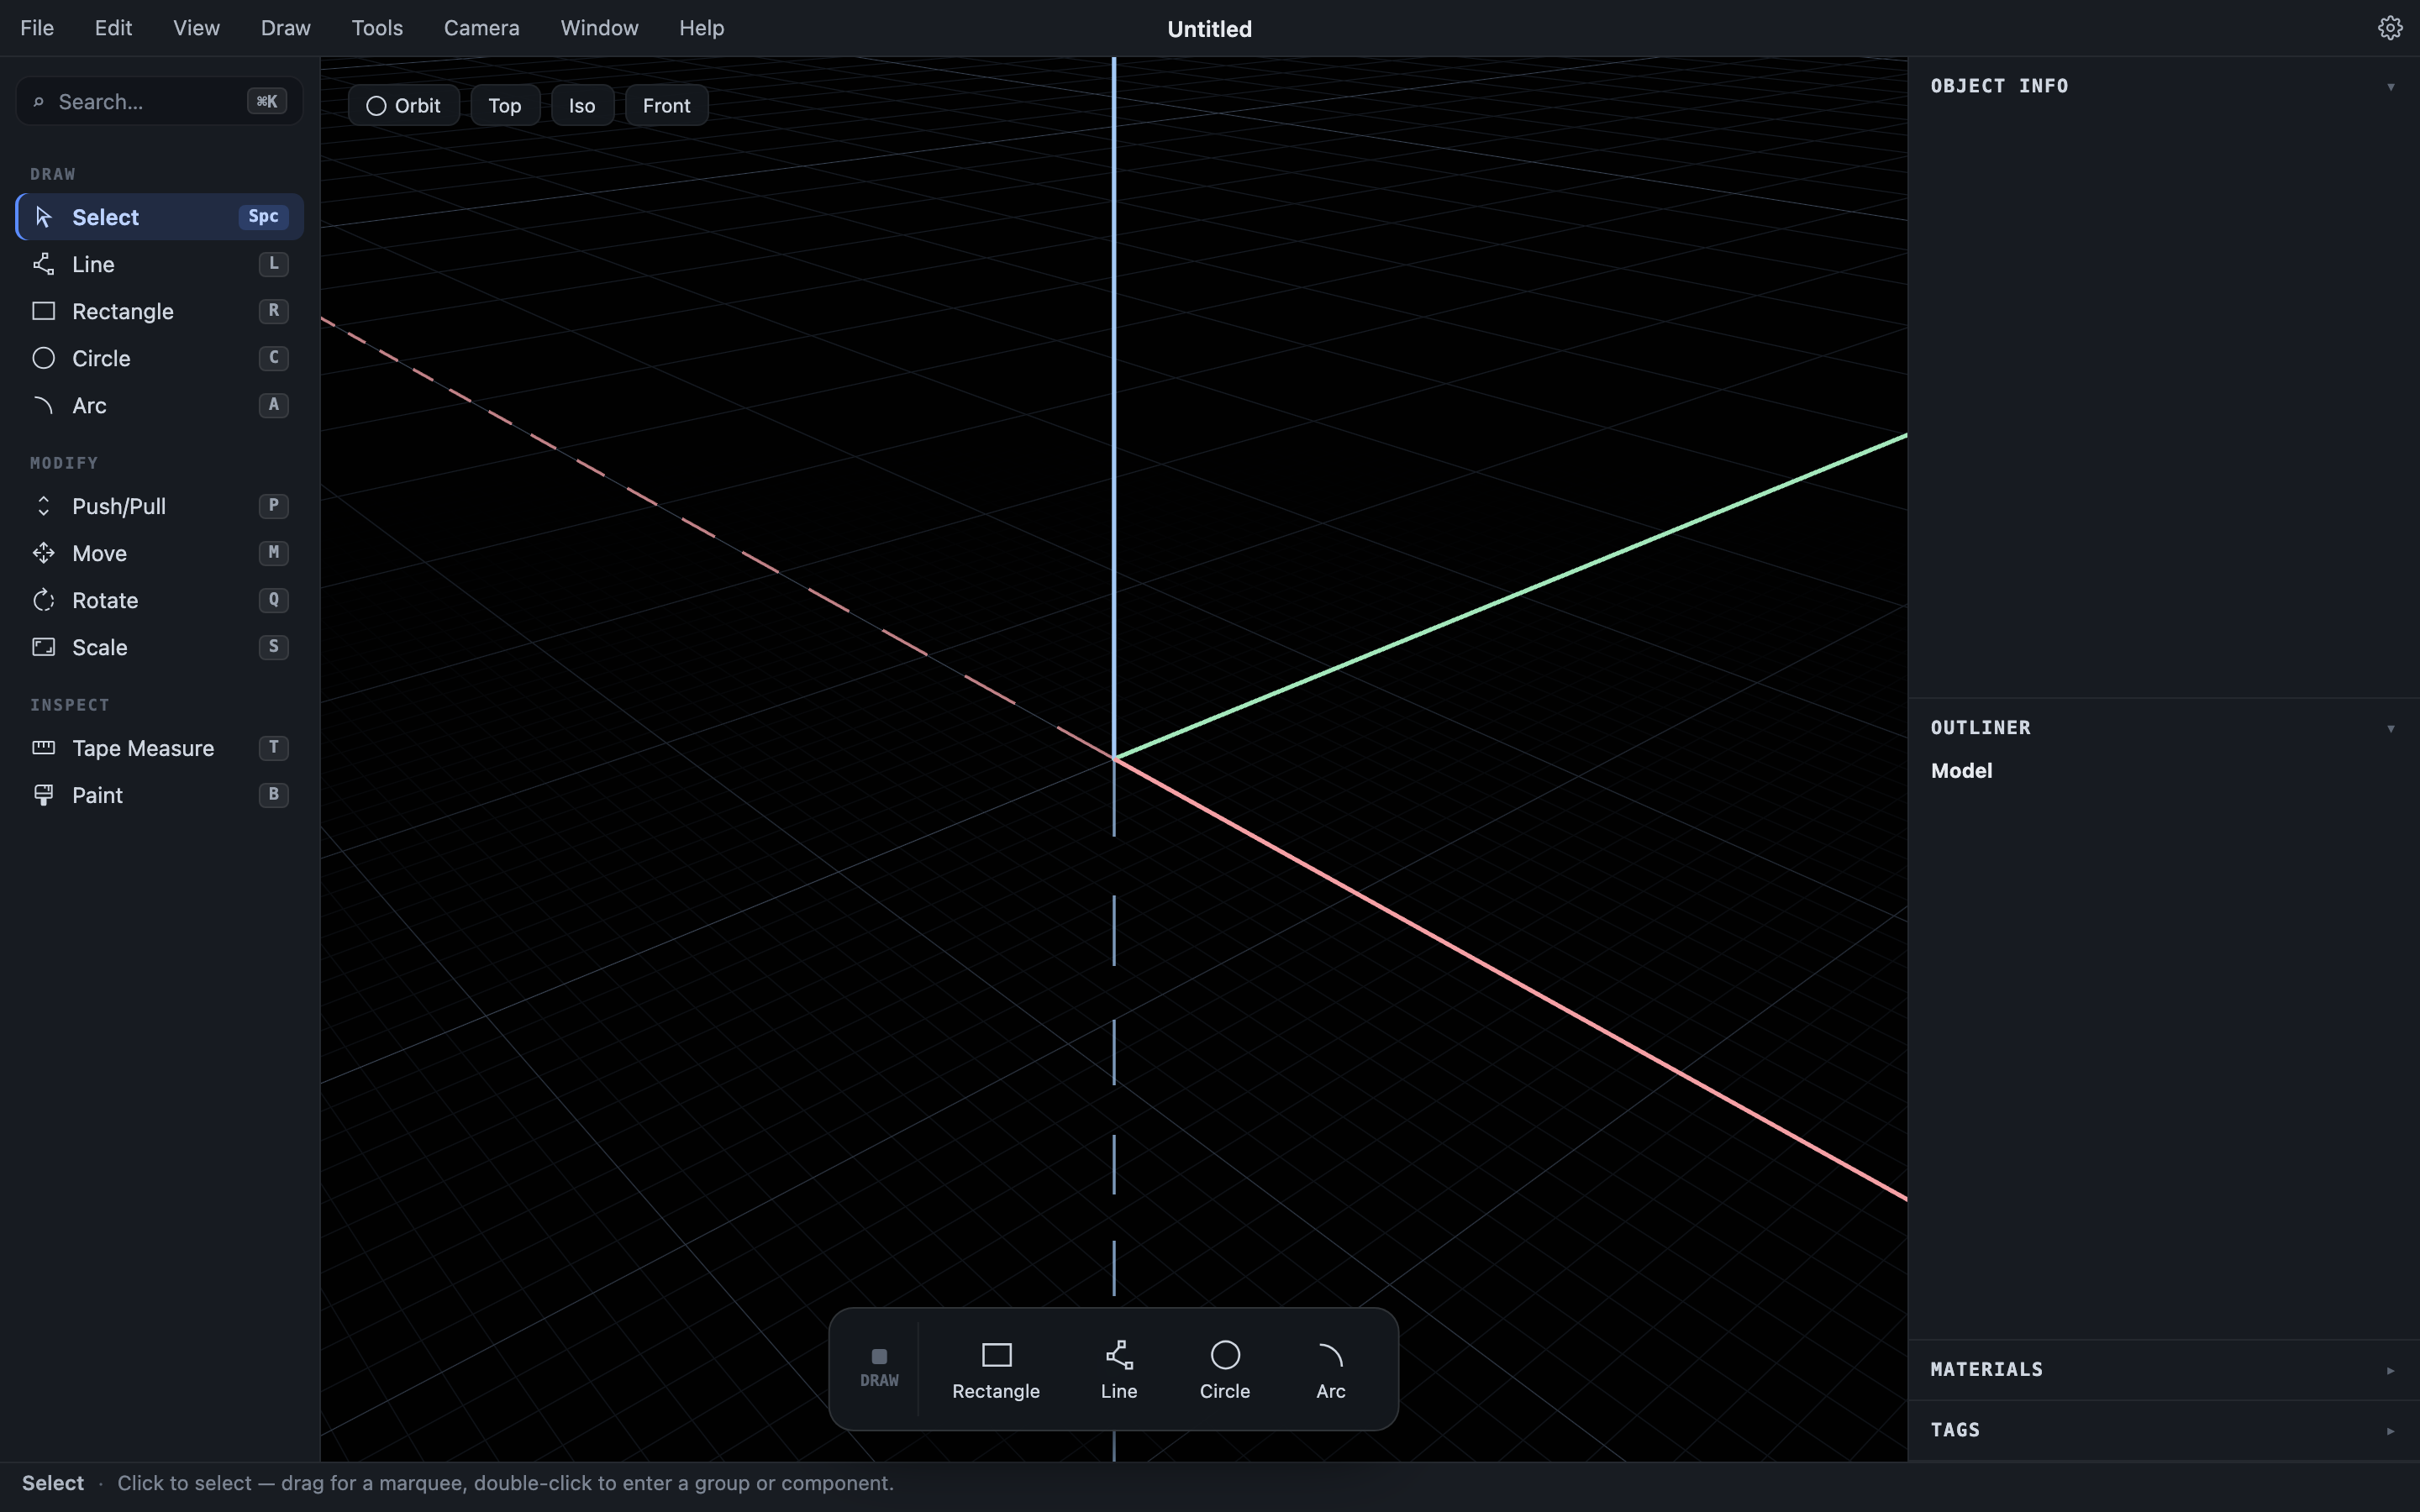
The viewport
The center of the window is the 3D viewport. A ground grid sits at height zero, and the three world axes cross at the origin: X is red, Y is green, Z is blue. Each axis is drawn solid on its positive side and dashed on its negative side. You can hide the axes with View ▸ Axes and the grid with View ▸ Grid.
The small chip row in the viewport’s top-left corner offers an Orbit button and one-click Top / Iso / Front standard views. A floating readout in the top-right corner shows live measurements (distance, angle, scale factor) while a tool is mid-gesture — that is, partway through an operation, after the first click but before the commit. You’ll meet that term throughout this manual. Anything you type also appears in this readout.
The tool rail
The left rail lists the everyday tools in three groups, each with its keyboard shortcut:
- Draw — Select
Space, LineL, RectangleR, CircleC, ArcA - Modify — Push/Pull
P, MoveM, RotateQ, ScaleS - Inspect — Tape Measure
T, PaintB
Six more tools don’t have rail slots: Protractor, Slice, Edit Vertex, and the dedicated camera tools Orbit O, Pan H, and Zoom Z. Reach them from the Tools and Camera menus, or from the command palette.
The command palette
The search field at the top of the tool rail opens the command palette, or press Ctrl K (web and Windows/Linux; ⌘K in a Mac browser, ⌘/ in the macOS desktop app). Type a few letters of anything: every tool, every menu action, and the objects, groups, and tags in your current model are all searchable. Synonyms work too — typing “extrude” finds Push/Pull, “slicer” finds Export.
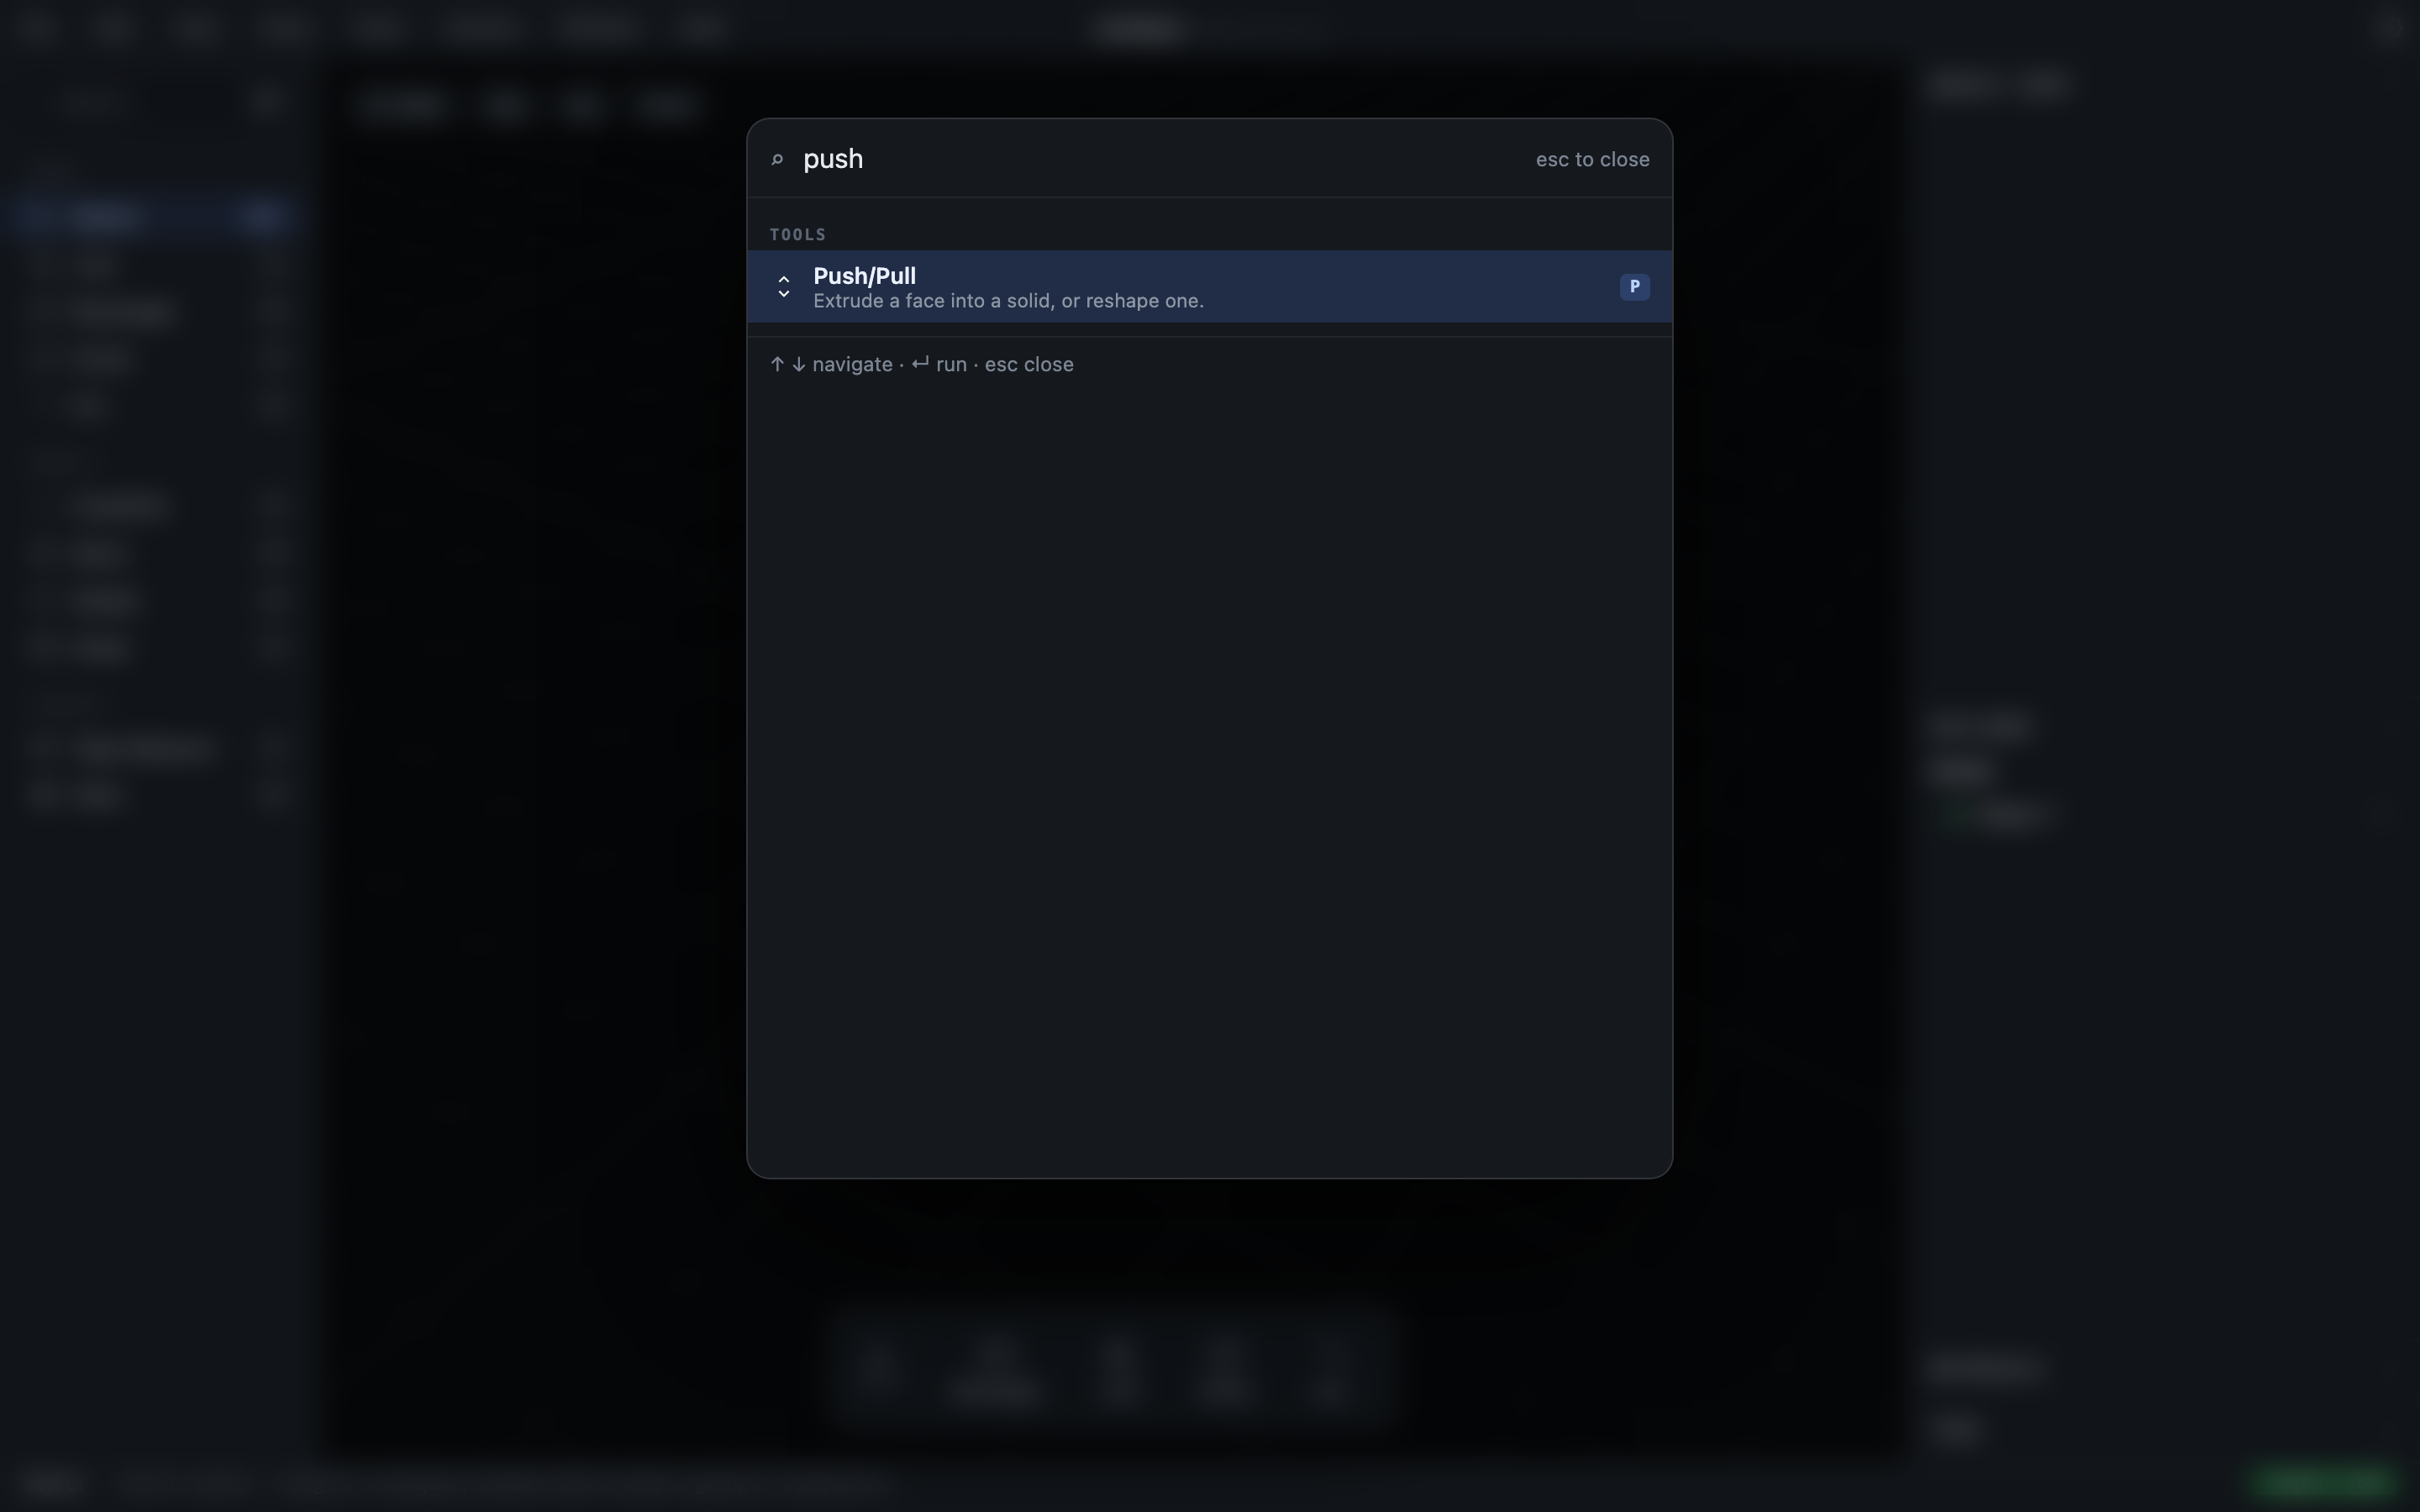
Press ↑/↓ to navigate, Enter to run, Esc to close. With an empty query the palette shows your recently used commands.
The contextual dock
The floating bar at the bottom-center of the viewport follows your selection and offers the most likely next actions:
| Selection | Dock shows |
|---|---|
| Nothing | Rectangle, Line, Circle, Arc |
| An Object | Push/Pull, Move, Paint, Erase |
| A group | Edit, Move, Scale, Ungroup, Erase |
| A component instance | Edit, Move, Scale, Make Unique, Explode |
| Several things | Move, Erase |
| A sketch | Push/Pull, Move, Rotate, Scale, Erase |
Everything on the dock also lives in the menus; nothing is reachable only from it.
The panels tray
The right-hand tray holds four collapsible panels. Click a panel’s header to expand or collapse it; drag the tray’s left edge to resize it. Each can also be shown or hidden from the Window menu:
- Object Info (Window ▸ Object Info,
⇧⌘O/Ctrl+Shift+O) shows the selected item’s name, type, solid status, and tags. This is where you rename things and tag them. - Outliner (Window ▸ Model Info,
⇧⌘I/Ctrl+Shift+I) is the document tree: every object, group, component instance, and sketch, with per-item visibility toggles. - Materials (Window ▸ Materials,
⇧⌘C/Ctrl+Shift+C) holds the document’s material palette. - Tags (Window ▸ Tags,
⇧⌘T/Ctrl+Shift+T) shows the tag tree, with visibility toggles per tag.
The Window menu also holds Debug Log, which toggles a diagnostics panel docked along the bottom of the window: a timestamped, severity-coded log of app events such as saves, imports, exports, and tool errors.
These panels are covered in depth in Organizing your model and Materials.
The status bar
The strip along the bottom always shows the active tool’s name and a one-line hint about what it expects next. If you’re ever unsure what a tool wants, look here. On the right, the watertightness badge summarizes the whole model: green “N objects ✓ solid” or red “N leaky”.
Menus and title bar
The menu bar (system bar on macOS, in-app elsewhere) organizes everything: File (new/open/save/import/export), Edit (undo, delete, group/component commands, booleans), View (axes, guides), Draw, Tools, Camera, Window, and Help ▸ Report Bug….
The window title shows the document name; a • in front of it (and an “Edited …” label next to it) means unsaved changes. There is no Save button; save with ⌘S / Ctrl+S. Files, saving, and recovery covers how autosave has your back regardless.
Light and dark
Hew follows your system appearance by default. To force light or dark, open Settings ▸ Theme (⌘, / Ctrl+,).